Regular Measurements Are Part of WLCC’s Activities
This is a preliminary publication of Williams Lake Conservation Company’s water levels report for the 2017 season.
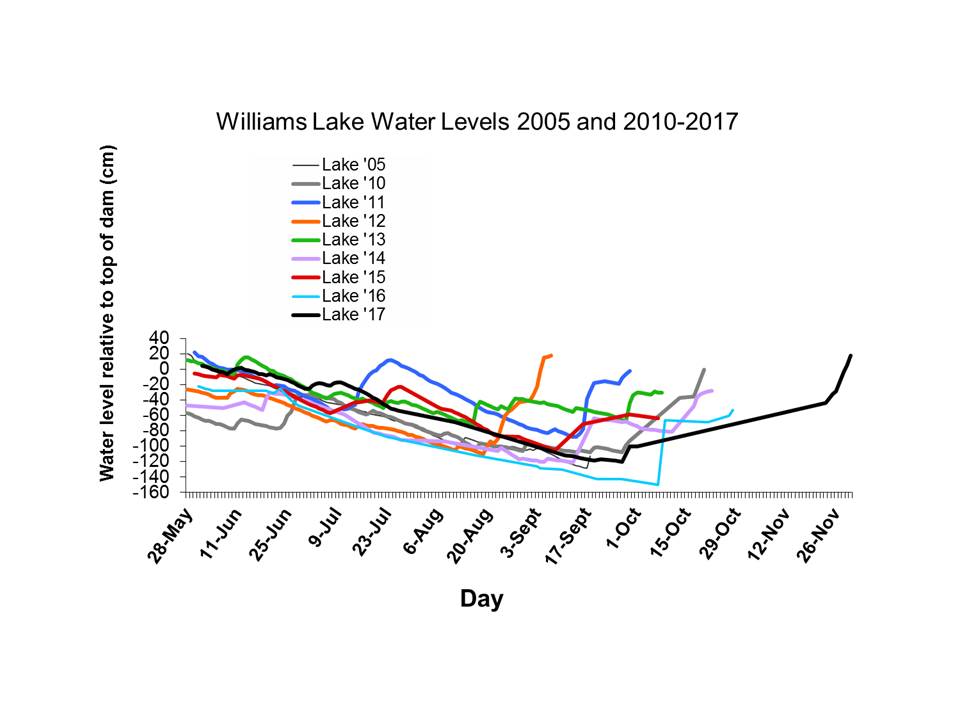
The graph below shows changes in levels from May to October, for years 2005 and 2010-2017.
Regular measurements are made from the top of the dam. A complicating factor is that the top of the dam itself has sunk, and so water levels may be lower than they appear.
The black line for 2017 shows the lake has not been as low as last year (light blue), but it appears to have taken longer to recover.
The importance of the lands around the lake, that constitute the watershed area, is illustrated by the fact that 1 cm of rainfall results in a 3 cm rise in the levels, as water makes its way to the lake.
Current levels (mid-March 2018) are pretty well at the maximum, as you might see if you notice the markings on the rocks visible from the Wyndrock Drive causeway.