Regular Measurements Part of WLCC’s Activities
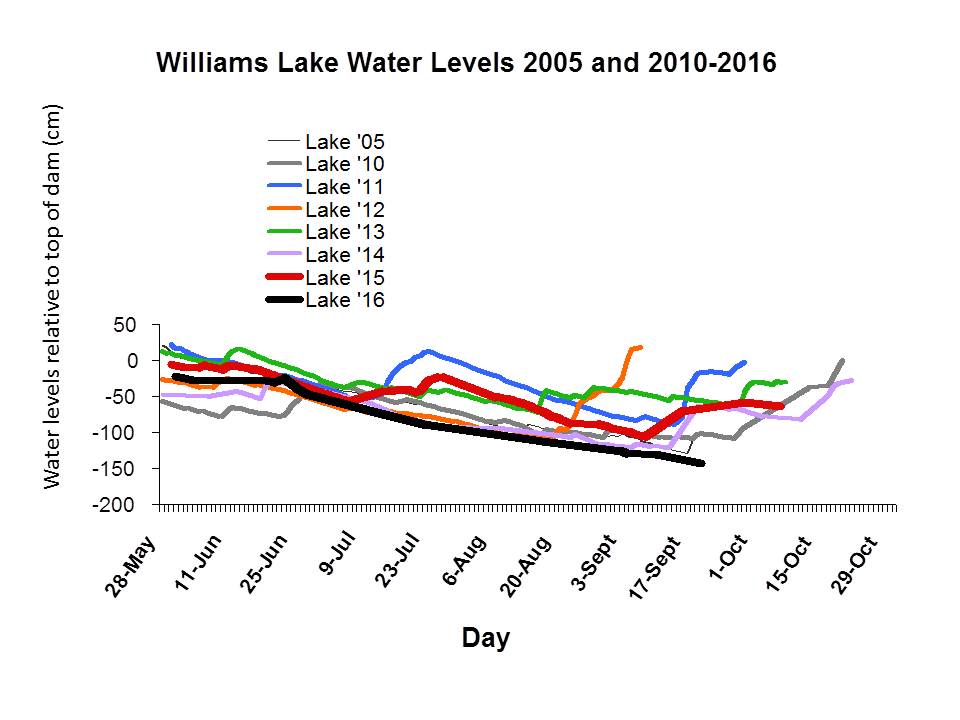
This week sees the publication of the Williams Lake Conservation Company’s latest water levels report. The graph shows changes in levels from May to October, for years 2005 and 2010-2016.
Regular measurements are made from the top of the dam. A complicating factor is that the top of the dam itself has sunk, and so water levels may actually be lower than they appear.
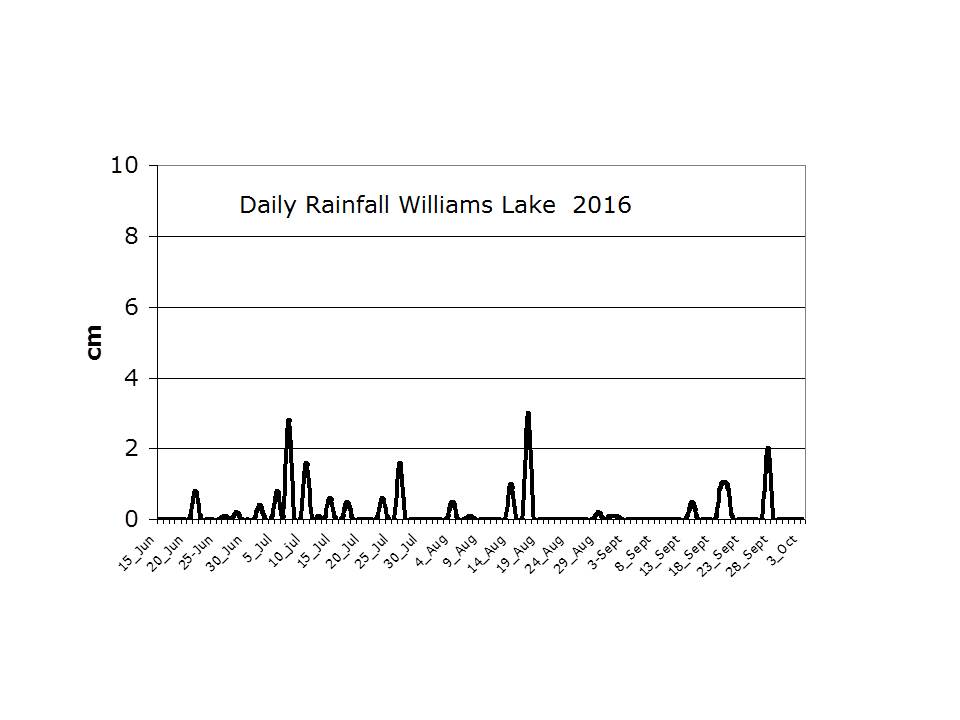
The black line for 2016 shows the lake has been at its lowest levels ever from July to September of this year. The water level rise that usually comes with the end of summer rains has not yet happened. This will not come as a surprise to anyone who’s noticed what a dry summer we’ve had.
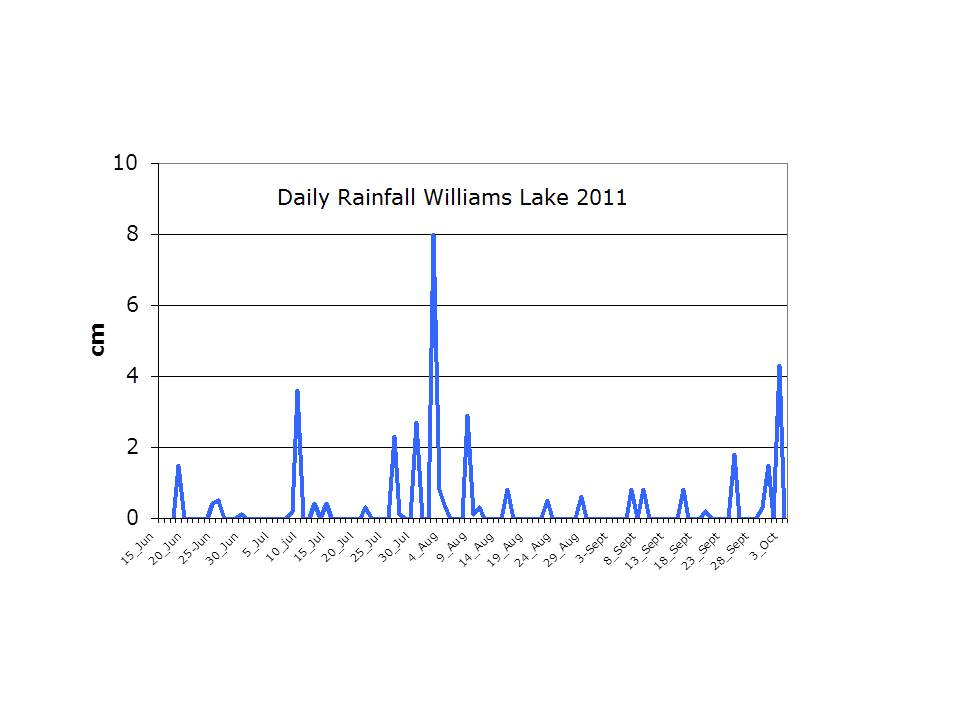
The importance of the lands around the lake, that constitute the watershed area, is illustrated by the fact that 1 cm of rainfall results in a 3 cm rise in the levels, as water makes its way to the lake.
To see the full Williams Lake Water Level Report for 2016 click this link.
To see all our Watershed Data Reports click this link.